How to collect GC-MS Spectra for GC-AutoFit
How to collect GC-MS Spectra for GC-AutoFit (GC-MS Sample Preparation Protocols)
How to use GC-AutoFit (General Instruction)
General Instruction
Required Spectrum Files for using GC-AutoFit
Three types of input files are required:
- An Alkane Standard file (required) - e.g. Alkane.mzXML, ALKstd.mzXML
- A Blank Sample file (optional but recommended) - e.g. Blank.mzXML, Blk.mzXML
- Sample files (required)
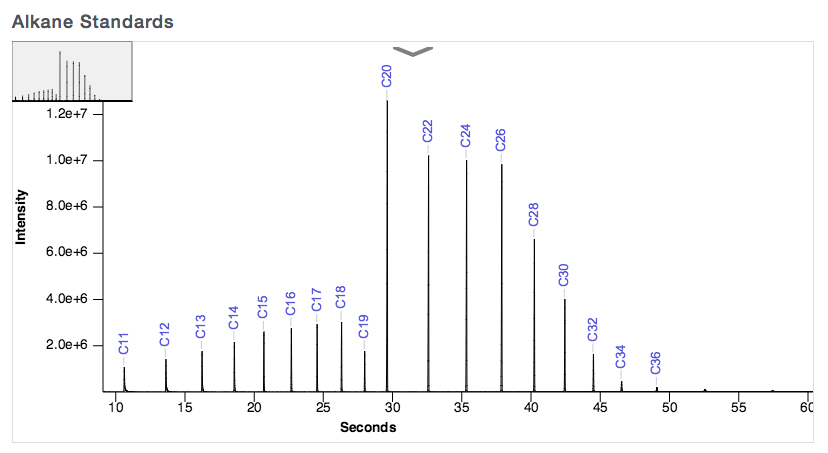
Preparing Alkane Standards
The retention times of alkane standard peaks are used for calculating the retention indices of each sample's peaks. The required range of alkane standards is from C10 up to at least C36, as shown below.
Converting File Formats (.CDF or .mzXML)
GC-AutoFit expects a file in .CDF or .mzXML format as input. If you are using Agilent's .D file format, you'll need to convert your input to .CDF or .mzXML format.
Conversion Software:
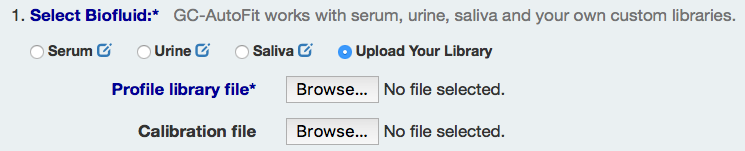
Choosing a Library and Internal Standard
You can choose to use one of internal libraries or upload your own library. You must select or submit an internal standard for quantification.
1) Select Biofluid type to use an Internal Library or Select the 'Upload Your Library' to use your own library.

or
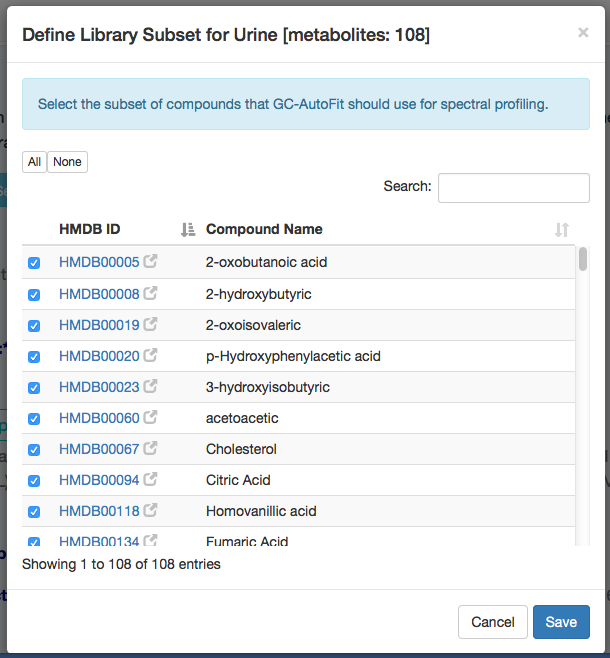
2) When you select a Biofluid type (e.g. "Urine") for the internal library, you can see the list of metabolites in that library by clicking the blue icon on the right side of Biofluid. You can choose all the metabolites or select a subset of them.
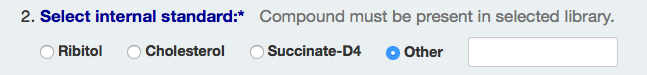
3) To quantify concentrations, you must specify the compound name of the internal standard. You can select one from the list or enter your own in the textbox by the choice 'Other'.
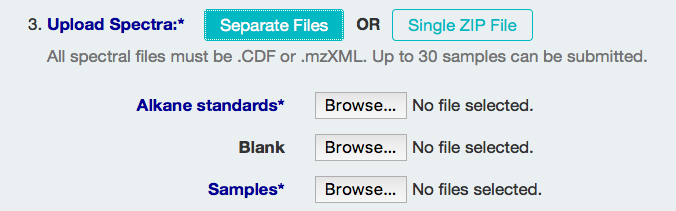
Uploading Spectrum Files
There are two ways to upload files. The first is to upload the Alkane Standards, Blank, and Sample files individually.
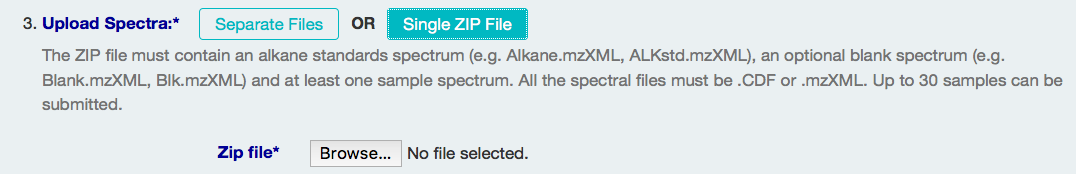
The second way is to upload a single zip file that includes all three types of spectrum files, named accordingly.
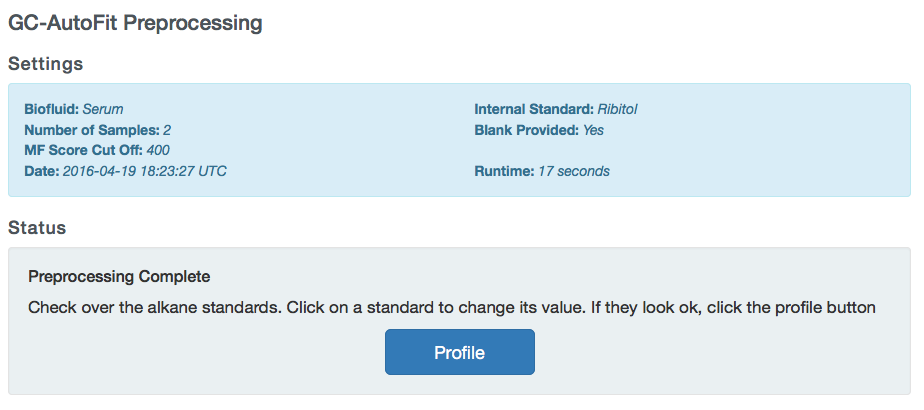
Checking Spectrum (Alkane Standard and Sample Spectra)
Before profiling, check over the Alkane Standad, Blank and Sample spectra, including any quality control spectra you may have. If any of the Alkane Standard values are wrong, click on the value and correct it.
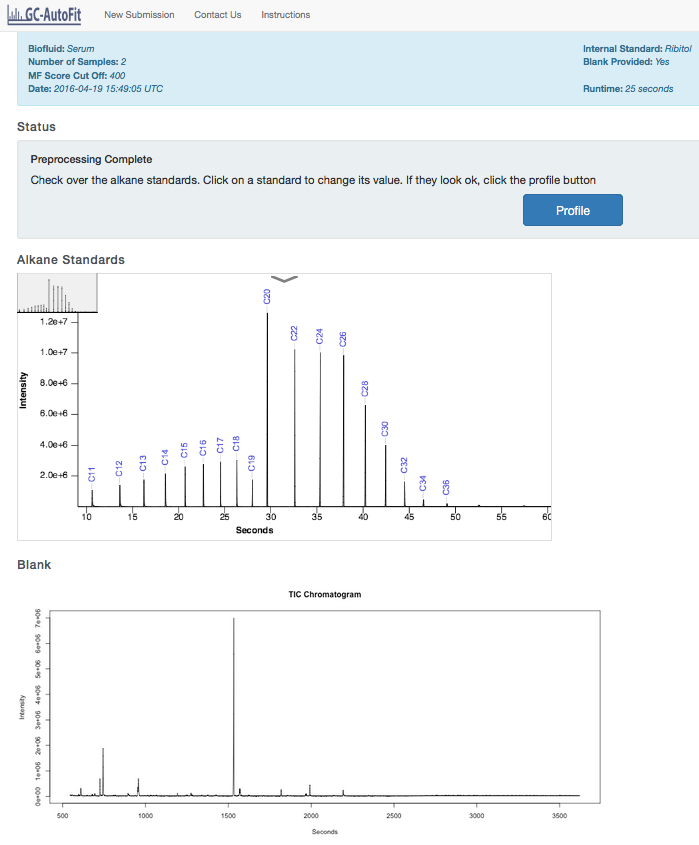
Perform Profiling
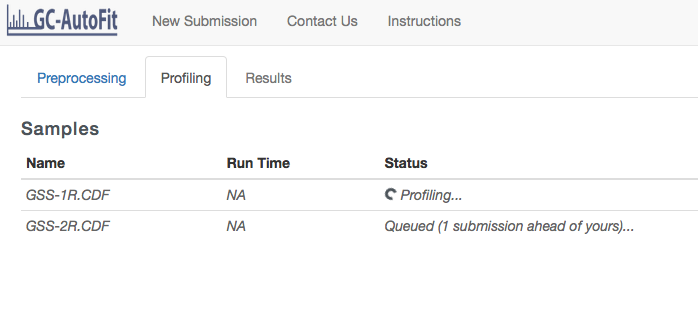
If there are no issues with the spectra, start profiling by clicking the Profile button.
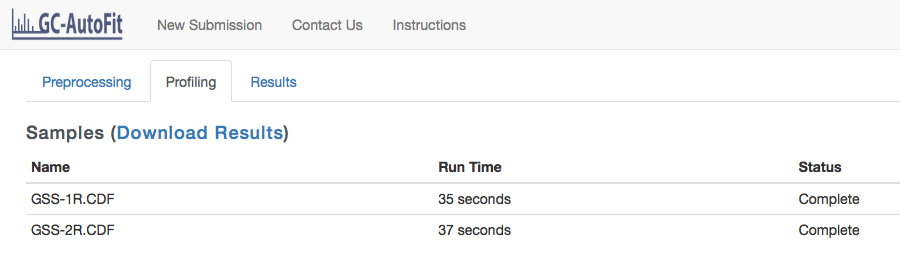
You will be taken to the Profiling page where the status of your spectra will be shown.
Getting Results for each Sample and the Final Concentration Table
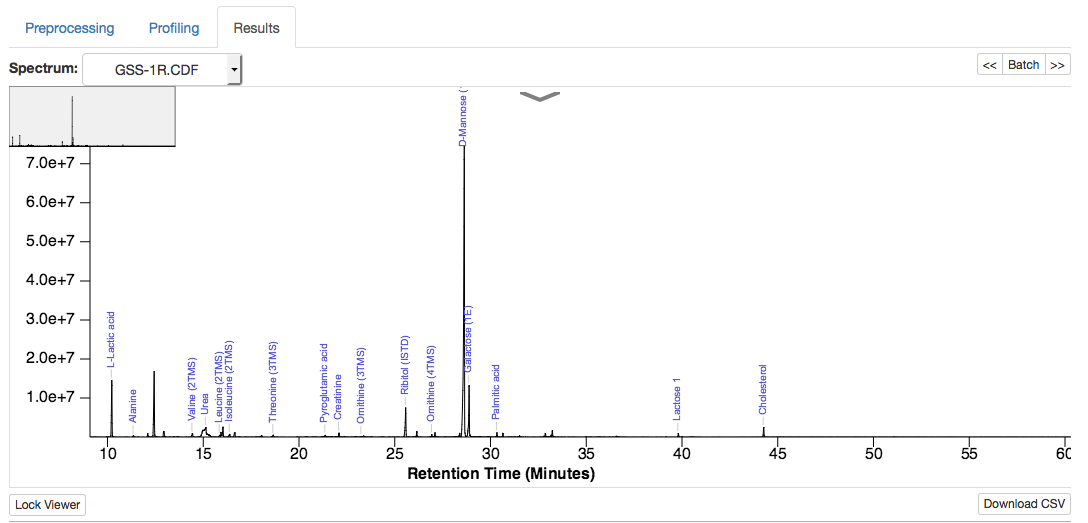
Once a sample has been profiled you can click on it and go to the Results tab to view the spectrum with assigned metabolites. The Download CSV
Results page:
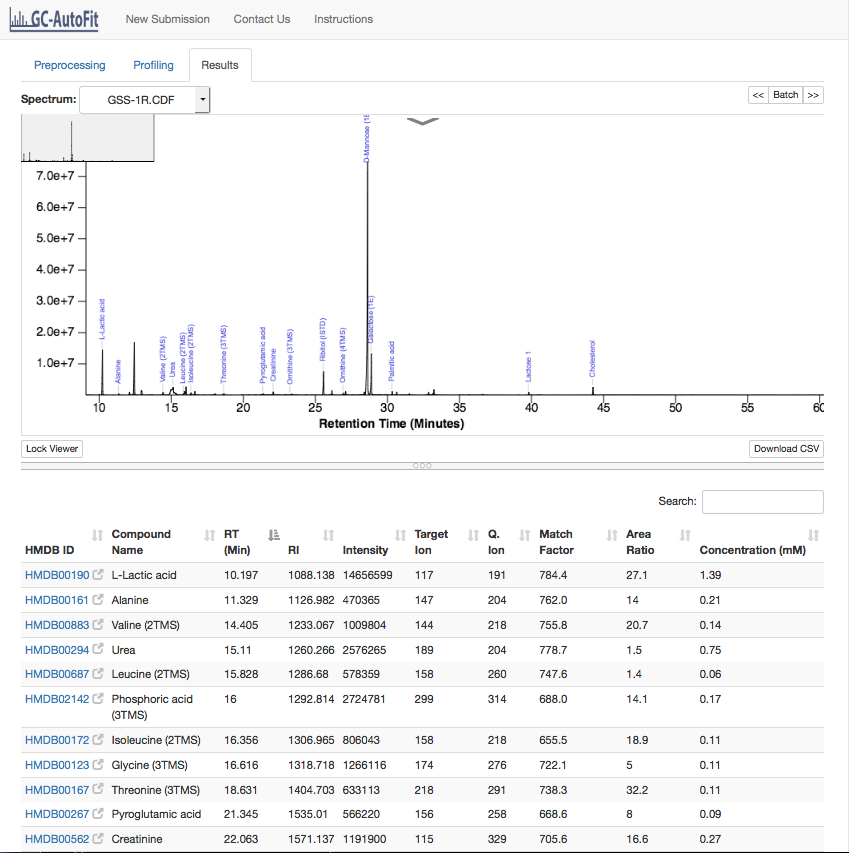
Porfiled table:
Spectrum plot (identified compound names, can be zoomed in/out):
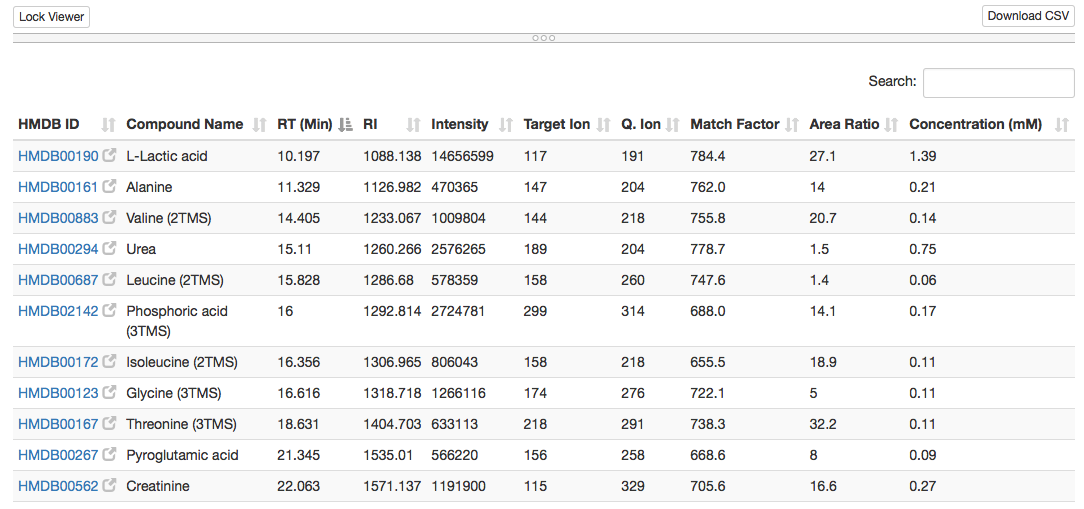
Merged concentration table (download CSV file by click the 'Download Results'):
Once all of the samples have been profiled, you can click the Download Results link in the Profiling tab to get a concentration table for all the samples.